
Why Lifetime Value Drives Every Smart Business Decision

If you can’t rattle off your own numbers, you’re tumbling behind. 2026 isn’t waiting for the slow movers. Customer lifetime value (LTV) isn’t a bonus feature anymore. LTV shows exactly how much money a business pulls in from one customer over the entire stretch—every single buy, a second purchase, any renewal or upgrade. Ignore that and you’re counting marbles in the dark. The most loyal customers sometimes come out quiet but steady—those are your long-haul revenue engines. Dump ad spend on flash-in-the-pan one-timers and you’ll watch budgets bleed, chasing churn disguised as progress. If you can’t measure LTV cleanly, you’re crossing busy traffic blindfolded.
It’s not just about spreadsheets and dashboards. You’ll lose loyal regulars before anyone even waves a flag. You sort your customers by what they’re really worth, not by gut feeling or some old habit from last year’s playbook. A few simple numbers will show you who deserves attention. Say you’re setting limits for how much to spend on ads or planning retention perks—you want those dollars working, not aimless.
This Deloitte report drops sharp examples and field-tested stats showing how the best brands have gone all in on lifetime value, doubling down as the old games lose steam. Every dollar spent to keep a high-LTV user tends to pay back more than whatever you sink into fishing for generic leads that barely stick. The plan for the rest: we’ll go stepwise, and break out tools you can actually use—dials and graphs giving you LTV in the moment, so there’s no guesswork left in those marketing meetings. Numbers go up, not just gut feelings or pretty slides.
- Step-by-step setup guide for tracking LTV using analytics software
- Troubleshooting data quality issues in LTV monitoring
- Visual dashboards for tracking LTV trends in real-time
- Workflow for automating LTV updates in SaaS and ecommerce
Key Elements of LTV Calculation

You need four building blocks. You want customer lifetime value that works? Average purchase value, that’s one. How often people actually buy, that’s two. Third, customer lifespan — how long they hang around before ghosting. Fourth, gross margin: what lands in your bank after you handle costs. Lose track of any one and your estimates warp — sometimes overnight.
Don’t count on the raw CSVs to hand you this cleanly. Refunds can bloat purchase counts, fast. In SaaS or subscription setups, half the time you’re piecing it together after the fact. When customer-level clarity gets lost, averages fill in the gap—or teams cobble together totals as raw metrics vanish into poorly named event logs. “Recurring” dollars versus one-offs? Data engineers split those streams, pull out refunds, dodge double-counted churn.
Plugging numbers into LTV math isn’t one-size-fits-all. Garbage in, garbage out — Harvard wrote up the blunder back in 2022. There’s the plain multiply-everything-together style, then the fuller version that actually sneaks gross margin into the equation — sometimes even a discount rate, or more surgical cohort splits if marketing wants control. Get one part wrong — it’s LTV drift all over again. Ask around: finance teams keep notebooks labeled “How to Accurately Track Customer Lifetime Value (LTV)” after fumbles. A competing platforms store I know realized their dashboards said LTV was 25% higher than reality.
| Metric / Formula | Description | Typical Calculation |
|---|---|---|
| Average Purchase Value | What the average customer drops per order. | Total Revenue ÷ Number of Purchases |
| Purchase Frequency | How often someone buys in a time window. | Number of Purchases ÷ Number of Customers |
| Customer Lifespan | Average user’s stay, tracked by year or month, whatever fits. | Sum of Customer Lifespans ÷ Number of Customers |
| Gross Margin | Cut out cost of goods, see what’s left. | (Revenue – COGS) ÷ Revenue |
| Basic LTV | The easy pass — skip margin, skip discounting, just multiply it out. | Average Purchase Value × Purchase Frequency × Customer Lifespan |
| Margin-Adjusted LTV | More honest — folds in margin, less fantasy. | Basic LTV × Gross Margin |
| Discounted LTV | Treats a future dollar as less — timing matters, especially with slow payouts. | Σ (Cash Flow ÷ (1 + Discount Rate)^t) |
Some teams can’t stop at the basics; churn tweaks and slicing by acquisition channel join the party. Test orders get cut to keep the graph clean. Get the raw elements shaped up before the numbers flow into Google Analytics, or any “How to Accurately Track Customer Lifetime Value (LTV)” plugin. Leave margin out or guess at lifespan, and your LTV sled hits a wall, especially if users show up in waves and disappear even faster.
Step-by-Step Guide for Setting Up LTV Tracking in Analytics Software

Harvard Business Review tallied up the mess from formula slip-ups in DTC and SaaS in this breakdown. Watch it ripple right through your ad targeting or next quarter’s hiring plan. Old timers had it right: check your base figures twice, and let the dashboard run from there.
Step 1: Collect Relevant Customer Data

- Start by listing every system that holds customer activity or transaction data—point-of-sale platforms, e-commerce sites, CRM software, and support ticketing tools are all fair game. Overlooking even one stream means incomplete figures later.
- Pull raw, time-stamped purchase records for each customer ID from your primary sales platform. Capture details like product, order value, and purchase date, since this backbone lets you link revenue to real behavior over time.
- Build simple queries or use dashboards that tally the number of purchases per customer in a set period. Frequency metrics highlight your true loyalists versus one-and-done shoppers. Power here shifts with cohort analysis.
- Locate signals that show customers repeatedly choose you—active subscriptions, renewal rates, or average time between orders. Use built-in CRM retention reports if available, or construct rolling twelve-month repeat-purchase charts for clarity.
- Merge exports from every tool into a master spreadsheet or use automation tools like Zapier or Segment to sync data directly into an analytics warehouse. Duplicates and mismatched IDs will cause headaches, so normalize every customer identifier with precision.
- Run spot checks—do test emails, match a sample order from the storefront against the database, and scan for zeros or odd spikes in sales. Even the slickest LTV formula fails if you’re working with patchy or stale logs. Data integrity beats clever math every time.
- Plug everything into a business intelligence platform or a specialized customer analytics suite (like Google Analytics 4 or competing platforms’s Revenue Analytics). These tools automate reconciliations and make it easier to visualize average order values and repeat purchase patterns, so you track how to accurately track customer lifetime value (LTV) without extra manual labor.
- Write down every source, step, and filter you use when collecting and cleaning data. Next month, when new data rolls in or if a stakeholder doubts your numbers, you’ll know exactly what shaped each LTV metric. Paper-trails save hours and smooth audits.
Mess up this foundational stage, and every LTV metric downstream is suspect. With granular, accurate data centralized and vetted, every future calculation and forecast stands on solid ground. For industry proven methods on defining metrics and setting up tracking workflows, check Deloitte’s guide to customer analytics methods at Deloitte customer analytics.
Step 2: Calculate Average Metrics That Feed Your LTV

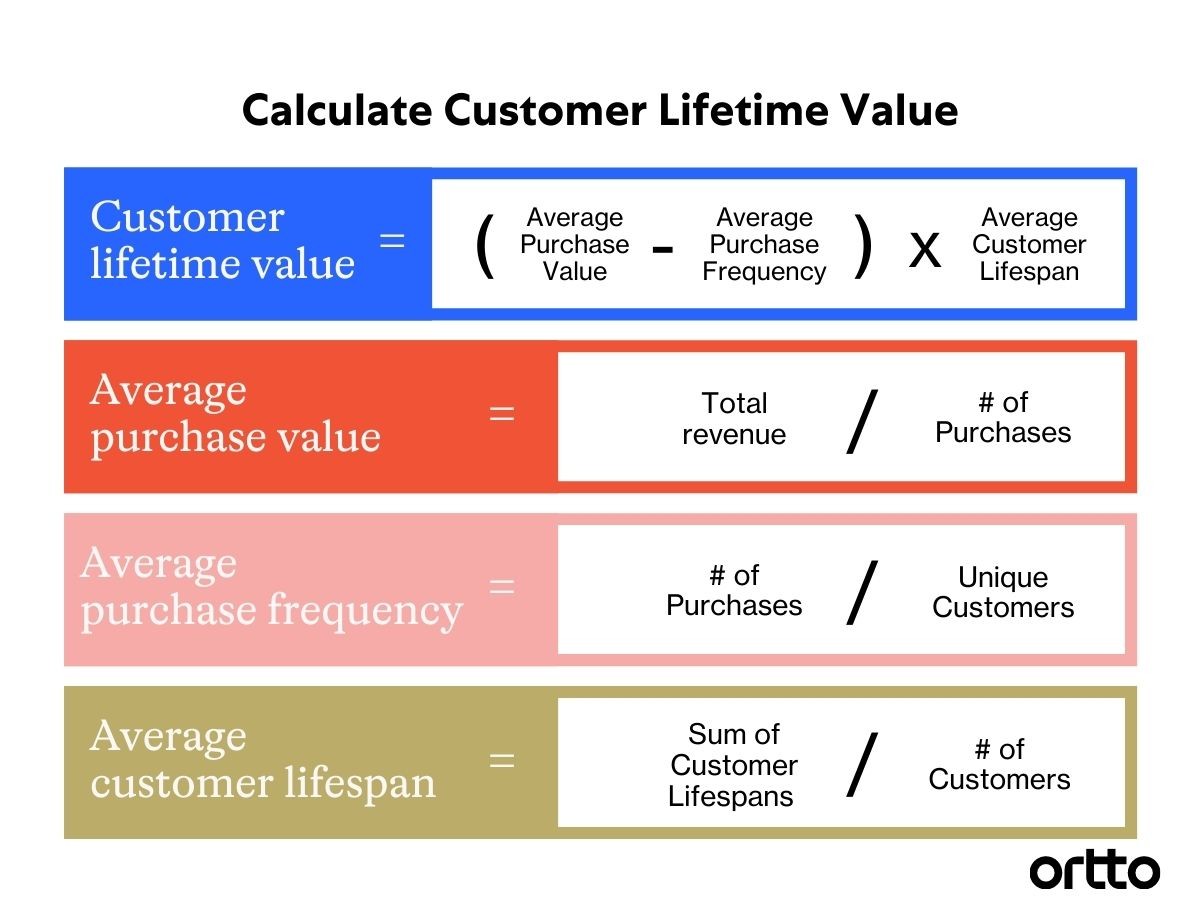
- Find Your Average Purchase Value. How many dollars does one buyer actually throw your way over 12 months? Stack up all the money from their purchases, then slice by how many times they hit “buy.” That gives you the number you really want. Jenny spent $2,400 across 12 orders? No secret fudge factor sits behind this—just the raw value per sale. It’s what your spreadsheet needs.
- Measure Average Purchase Frequency. Ignore what people say. Count all real transactions in your time window, then carve that number by unique customers—wallets that actually opened up. If you see 1,000 sales logged with 250 buyers on the roster in 2025, you’ve got a real frequency: four trips to checkout per person. That fraction is the echo of loyalty, not sales talk. The clinical eye lives here.
- Calculate Average Customer Lifespan. Scavenge through every quarterly report. Open the CRM and pull dates. How long until someone stops showing up? A SaaS subscription: users tend to linger two to four years, dragging out upgrades and seat counts. Loyalty leaks fast—sometimes a year, sometimes only a season. Add the total years across paying customers, split that by headcount, and you’ve revealed the secret half-lives—fans and dropouts both shaping the score. Lifespan stares churn in the face and doesn’t blink.
- Estimate LTV Using the Right Formula. This is where the machinery locks up. Every number above pulls weight: LTV = Average Purchase Value × Average Purchase Frequency × Average Customer Lifespan. Keep the gears synced—use the same time units for each. Say your math hits $200 per sale, each buyer returns four times a year, and stays three years. The equation lands at $2,400. No wishful doodle—this is the bar you build next quarter on.
- Document Assumptions, Time Frames, Outliers. Don’t smooth the rough stuff. Did you measure before or after returns? Did you batch first-timers with serial buyers? If segment quirks vanished, averages warp and drag forecasts downhill. Note if you ran numbers over a lifetime or only a rolling year—every cut matters. Messy math spits garbage out the other side. One broken variable can swallow your whole LTV project.
Others churn at a sprint.
| Metric | Formula | Example with Values | Impact |
|---|---|---|---|
| Average Purchase Value | Total Revenue ÷ Total Purchases | $2,400 ÷ 12 = $200 | Dials into transaction size |
| Average Purchase Frequency | Total Purchases ÷ Unique Customers | 1,000 ÷ 250 = 4 | Pulse of repeat buying |
| Average Customer Lifespan | Total Years Across Customers ÷ Number of Customers | 750 ÷ 250 = 3 years | Churn gets real |
| LTV | Value × Frequency × Lifespan | $200 × 4 × 3 = $2,400 | North star for growth |
Dashboards eat these numbers raw. Google Analytics, rival tools, whatever runs the shop floor. You lean on them: forecasts, campaign pivots, that Friday board deck. A single rotten field—say repeat purchase rates drawn from duplicate data—poisons the whole batch. alternative options’s 2025 data quality report showed companies throwing millions away, torched because someone missed a number or ran the hours wrong. Get these right, or the rest crumples.
Step 3: Apply the LTV Formula
- Get the average purchase value, purchase frequency, average customer lifespan, and churn rate you gathered from earlier analytics work. These numbers form the backbone of how to accurately track customer lifetime value (LTV). Small errors here will throw off the whole result.
- Take your total revenue over a set period—say, $75,000 last quarter—and divide it by the total number of purchases, for example, 1,000. That gives you an average purchase value of $75. This is the “meat” of the formula.
- Count how many times, on average, a single customer buys from you in the period. Divide the number of total purchases (1,000) by the number of unique customers (200) to get a purchase frequency of 5. This number reveals real engagement.
- Multiply average purchase value ($75) by purchase frequency (5) to see that each customer brings in $375 per quarter. It’s the single biggest lever you can pull.
- Measure how long, in years, the average customer sticks around—most subscription businesses use churn data to fine-tune this. If your churn rate is 25%, the average lifespan is 1 ÷ 0.25, which equals 4 years.
- Multiply customer value ($375) by average lifespan (4 years), so $375 × 4 = $1,500 LTV. This gives you a clean, actionable number.
- Scan for outliers, odd spikes, or missing transaction data before finalizing your LTV calculation. Bad inputs mean garbage output. Platform dashboards in Google Analytics or other solutions can help you spot these fast.
- Post your calculated LTV in your team’s dashboard and revisit the number monthly. A stagnant LTV can warn of a product or retention problem.
Worked Example Table
| Metric | Example Value | Calculation | Result |
|---|---|---|---|
| Total Revenue (Quarter) | $75,000 | — | $75,000 |
| Number of Purchases | 1,000 | — | 1,000 |
| Unique Customers | 200 | — | 200 |
| Average Purchase Value | $75 | $75,000 ÷ 1,000 | $75 |
| Purchase Frequency | 5 | 1,000 ÷ 200 | 5 |
| Customer Value | $375 | $75 × 5 | $375 |
| Churn Rate | 25% | — | 25% |
| Average Lifespan (Years) | 4 | 1 ÷ 0.25 | 4 |
| Lifetime Value (LTV) | $1,500 | $375 × 4 | $1,500 |
Banking on an accurate LTV lets you make smarter bets on ad spend, retention investments, and pricing shifts—miss a decimal here and you risk overspending on the wrong acquisition channel for months before you catch it. Frequent checks build in resilience, while a clear table like the one above saves your team from second-guessing the math when the next budgeting cycle begins. For additional technical detail and LTV methodologies, the Gartner customer experience resource center provides standards used in large-scale CRM practices.
Step 4: Automate LTV Tracking with Tools
- What’s the right platform for your LTV game? Google Analytics, comparable services, Mixpanel, Amplitude—all sell a real LTV tool by early 2026. No more homemade scripts taped to old dashboards. Competing platforms clicks fast; Mixpanel asks for more setup.
- Bring in the whole pile: ecommerce orders, CRM profiles, payment logs. Toss rival tools into Google Analytics 4—done in two clicks, most days. Maybe Stripe or other solutions plugs in easy, but you’ll need Zapier or a custom API to connect homemade setups. Keep your eye sharper for sync errors in that case: they creep, slow, and silent.
- Use a single unique customer ID. It can be an email, maybe a UUID generated by your system. This ID is your anchor across the stack. Double-counted, lost records, LTV riddled with holes. Finance hates a wandering identifier.
- Trigger trackers for purchases, renewals, refunds, cancellations. Tack order value, product info, and your single customer ID to every record. The analytics engine needs clean, simple signals. Otherwise you get stuck hunting down stray cents in spreadsheets.
- Build shopper groups by first purchase date, promo code caught, or product bought. Some dashboards—rival tools’s “Customer Value Over Time”—show it all instantly. Cohorts tease apart spikes and dips you’d never spot in a messy average. Email leads may shine; last summer’s campaign brings ghosts.
- Set up live imports, or webhooks. Let your system munch new transactions the moment they pop up. Rot sets in, lag bites, and you’re debugging at midnight. Automated sync keeps LTV graphs fresh—last Tuesday’s fossil doesn’t fool anyone.
- Google Analytics 4, Amplitude—they complain fast when events vanish, when records show up twice, when ID chunks go missing. Comparable services, email, in-app, anything that shoves a glitch into daylight. If the alarm goes quiet, don’t relax. That’s smoke in the basement.
- Build LTV dashboards—history lines, cohort blocks, channel splits. Wire for daily refresh from direct data, not backroom dumps. Growth lead, product boss, suspicious finance person—now they spot spikes, weird dips, and channel nosedives without sifting through old CSVs.
- Schedule LTV numbers to land in inboxes. Mixpanel, alternative options send bursts weekly or monthly—you choose. If LTV dives or leaps, the right team knows fast—not buried two quarters deep in a postmortem.
- Look under the hood every quarter. Did a new channel toss IDs askew? Check logs and integration histories—catch weirdness before it multiplies into a five-person rescue mission or endless meetings.
Code LTV deep into your stack, and numbers come when called. Crawl forward with spreadsheets, and get burned. Manual steps chew up time, dent trust, sap daylight. The teams with solid LTV tracking don’t imagine what customers are worth—they see it plain, and don’t slip. Finer points, edge cases, compliance quirks? Check official Google Analytics documentation on LTV setup and validation—careful steps fit the API twists and privacy traps of 2026.
Common Pitfalls and Troubleshooting
- Relying on outdated or incomplete data skews your LTV numbers, creating a false pulse for your business. Cross-check upstream data sources for gaps, duplicate records, or missing churn signals before running any calculations.
- Treating your entire customer base as a single block often hides the best and the worst performers. Use customer segmentation in your analytics tool to split out VIPs, bargain shoppers, or churn-prone segments—averaging them together dilutes any learning.
- Accidentally lumping all purchases into a single time window ignores non-linear buying cycles and seasonal spikes. Longer-tailed cohorts need their own lanes in your dashboards, since purchase cadence can change year to year, impacting how you track How to Accurately Track Customer Lifetime Value (LTV) over time.
- Failing to reconcile transactions from multiple systems (point-of-sale, web, app, third-party platforms) leads to under-counted revenue and missed customer touchpoints. Push for a unified pipeline or automated ETL job to standardize and validate all transaction data before you run the LTV math.
- Ignoring refund and return rates—especially for physical products—means you’ll inflate customer lifetime value beyond reality. Always deduct returned revenue and adjust cohort calculations to reflect true net income generated by each customer group. Net revenue is the truth.
- Not adjusting for discounting or loyalty credits skews LTV, particularly for e-commerce or SaaS businesses where heavy promotion can mask low-margin relationships. Bake discount fields into your LTV query layer so you measure profit, not just top-line glory.
- Letting attribution models default to last-click or first-touch can push LTV estimates in the wrong direction, especially for long sales cycles or multi-channel buyers. If possible, move toward a weighted or position-based model to nail true lifetime value by customer journey.
- Overlooking churn timing and renewal behavior, especially in subscription models, warps forecasts and leads to irrational spending on acquisition or retention. Ensure cohort definitions in How to Accurately Track Customer Lifetime Value (LTV) include explicit churn flags and capture renewal behavior in your tracking setup.
- Focusing only on gross LTV and ignoring Customer Acquisition Cost (CAC) leaves you blind to actual business health—always present LTV alongside blended CAC to reveal true profit and payback period. Grow with both eyes open.
Keep every data stream sharp and every dashboard segmented. Cleaning up your LTV foundation is non-negotiable if you want actionable numbers powering decisions. For research-backed analytics practices and benchmarks, review the current Forrester Customer Experience Index and analytics documentation to see how top-performing businesses set up their LTV engines in 2026.
Turning LTV Insight Into Strategic Action
You don’t just slap an LTV number on a PowerPoint and call it done. There’s nuance hiding in the math. Track how often your buyers show up, how much they fork over, how fast they vanish, and what it costs to win them in the first place. Put all that together, and what you’ve got is a living pulse — not just a static metric. A tool you can wield. Bad LTV data? It’s not a small glitch. Product teams follow dead ends. Ad spend goes down a hole. Planning freezes under your feet, and every risk feels more like roulette.
- Go scan your LTV data pipeline; does any field drop off the map, or show up weird half the time? Patch it now — not next Q4, when it’s too late to react.
- Choose your analytics platform, not just the shiniest one — it has to mesh with your stack. Connect live streams: purchase logs, customer IDs, churn events, and engagement. Don’t juggle CSV files at midnight.
- Spin up a single LTV dashboard. Segment the view — show cohort splits, not just mashed averages, so actual patterns surface instead of blending away.
- Schedule back your LTV review, every month or every quarter. The world won’t sit still, and neither should your assumptions or formulas. Tune them when the ground shifts.
- Drag past cohorts through your latest LTV formulas. Missed signals pop up only when you test backward. Catch them before weird models become company gospel.
Now, how should you act? Point the new numbers at your highest-value groups, pamper them so they last. Go on offense for folks on the edge; don’t let them slide out the side door. Funnel money and attention only into channels that stack your revenue instead of leaking it. LTV is foundation, not furniture. If you want more, Gartner’s analytics research center (link) has industry benchmarks and sharper proven methods. No, there’s no golden rule for the “right” formula. But you can get close—if you audit, revise, and invest in the proper tools. You’ll spin ordinary transactions into real business muscle with time. Sometimes the real compounding happens every time you make a sharply-informed decision, not just in your bank account.